Want To Know Your Yearly Electrical Usage and How Solar Can Cover That Usage?
 Finding Your Annual Electric Usage
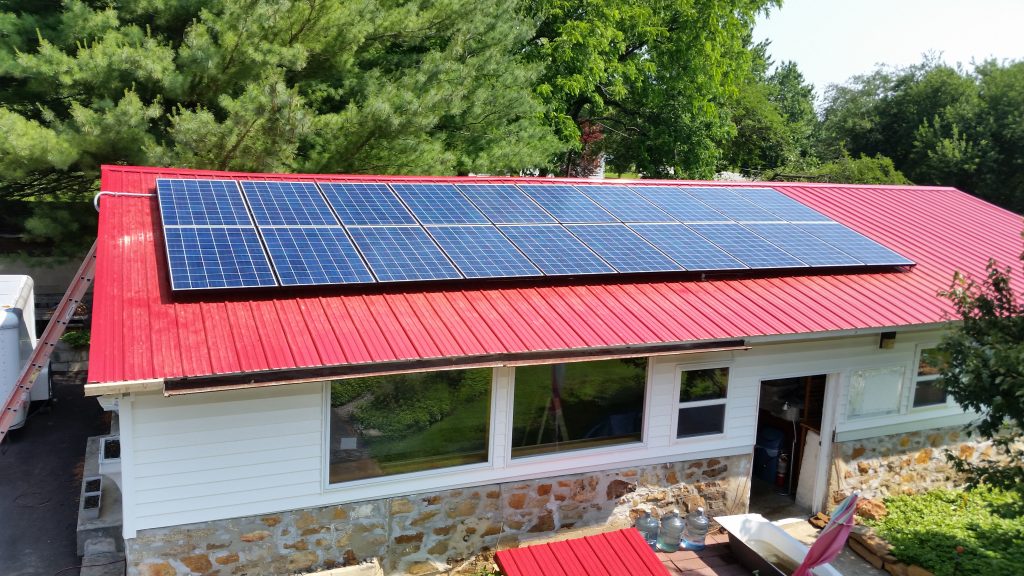
One of the most common questions we field at MSSI is, what can solar do for me in combination with how fast can I pay back the system I’ve had installed? These two questions are intimately involved and have everything to do with your electric usage. We pay for electricity by the kilowatt hour. Knowing our monthly kWh usage gives us a picture of what our usage is annually. Once we know that number, we can more accurately know what size system you need to meet your goals and/or current electrical demand. For instance, if I’m using 12,000 kWh per year and I want to cover my usage 100% with solar, my solar array would need to produce 12,000 kWh or more. On average Americans use 10,932 kWh per year. The higher your usage, the larger system you will need to have installed. The eventual size of your system depends upon your usage, goals and budget.
Finding Your Annual Usage On Your Bill
So, how do you find your annual usage without having to create an elaborate Excel sheet that you plod you way through for a year? While obscure, your bill will tell you. Below are examples of utility bills from across the state and how to discern that information from your bills.
Baltimore Gas and Electric
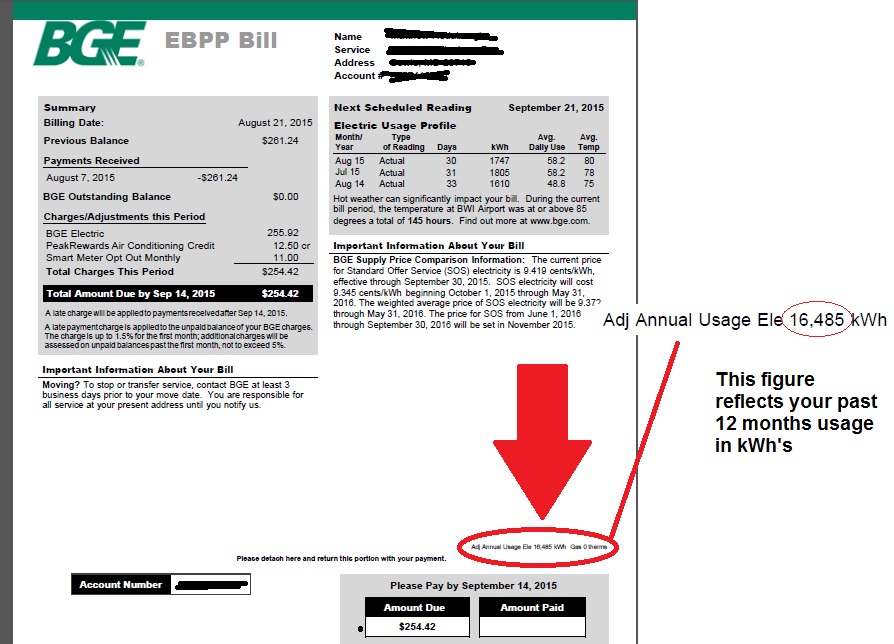
Above the portion that you would tear off to send in with your payment, you will find the Adjusted Annual Usage. This is your current year-to-date electrical usage. The total kWh in this example is 16,485. In order to cover this usage the solar array installed would need to generate 16,485 kWh or more per year.
Delmarva Power
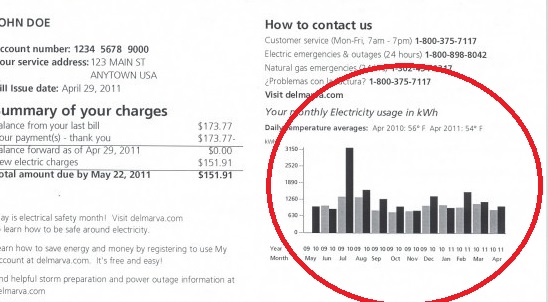
Extrapolating annual usage from the Delmarva Power bill is a little trickier than with simply finding a single number on the BGE bill because Delmarva provides your yearly kWh usage in a handy bar graph. The horizontal line along the bottom of the bar graph notates the years. In the above example the years in question are 2009 and 2010. The perpendicular line along the left hand side is indicative of the amount of electricity used.
In this instance, it looks like this family used:
May ’10: 700
June ’10: 1250
July ’10: 1260
August ’10: 650
September ’10: 630
October ’10: 700
November ’10: 650
December ’10: 1260
January ’10: 800
February ’10: 1500
March ’10: 1200
April ’10: 820
Total: 11,420 kWh
Potomac Electric Power Company/PEPCO
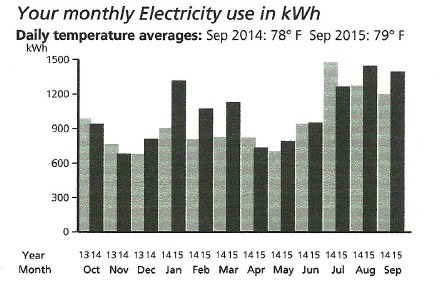
Like Delmarva Power, PEPCO uses a bar graph to convey annual electric usage. In this instance we’re looking at about 12,400 kWh per year.
Potomac Edison
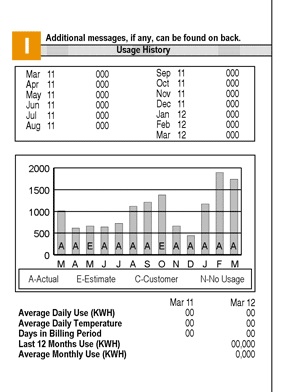
Potomac Edison bills include both a bar graph and a line item that denotes the “Last 12 Months Use (KWH).”
Southern Maryland Electric Cooperative/SMECO

SMECO gives you a bar graph that takes all the guess work out because your monthly usage is numerated above each bar. In this instance, the yearly usage adds up to 29,751.


