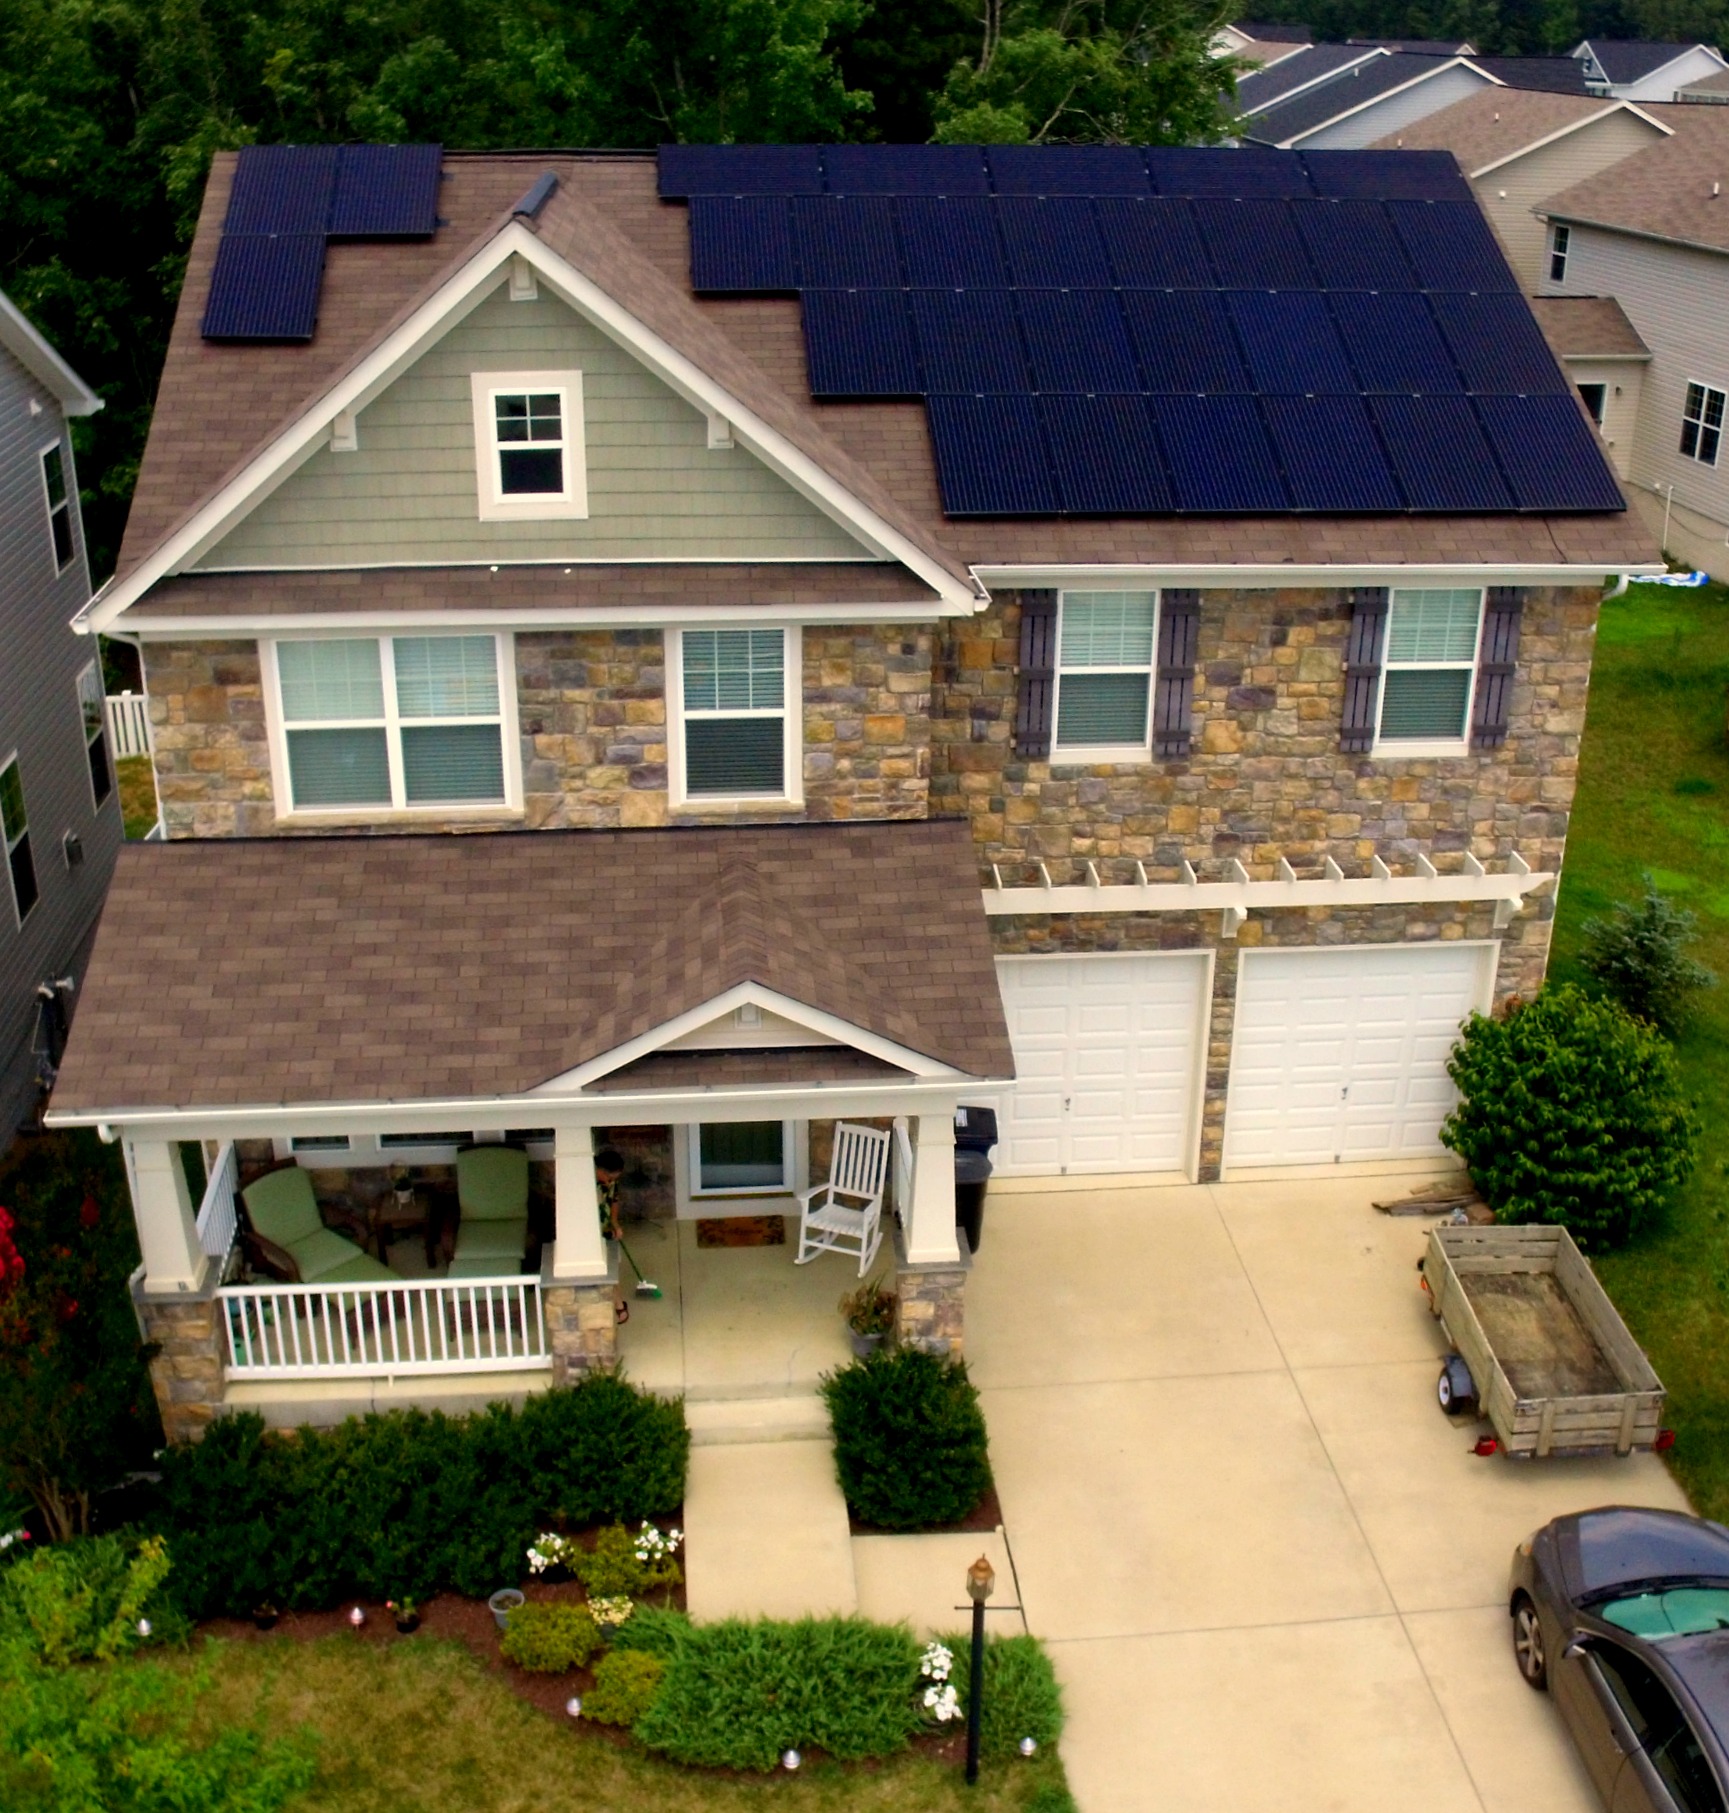
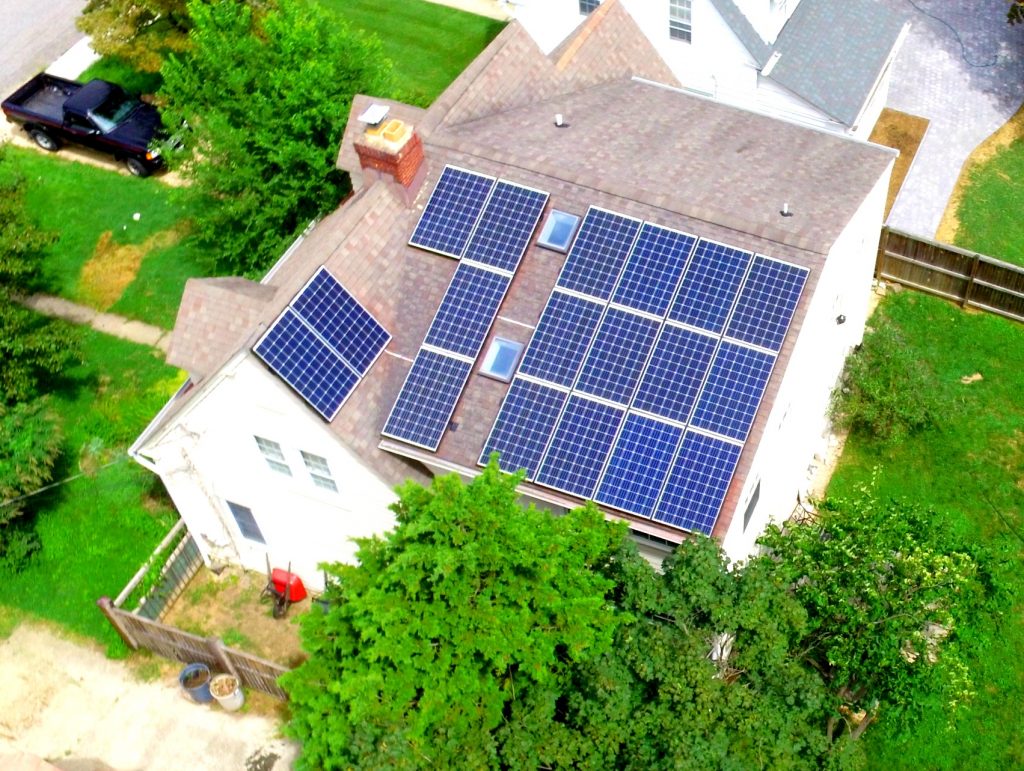
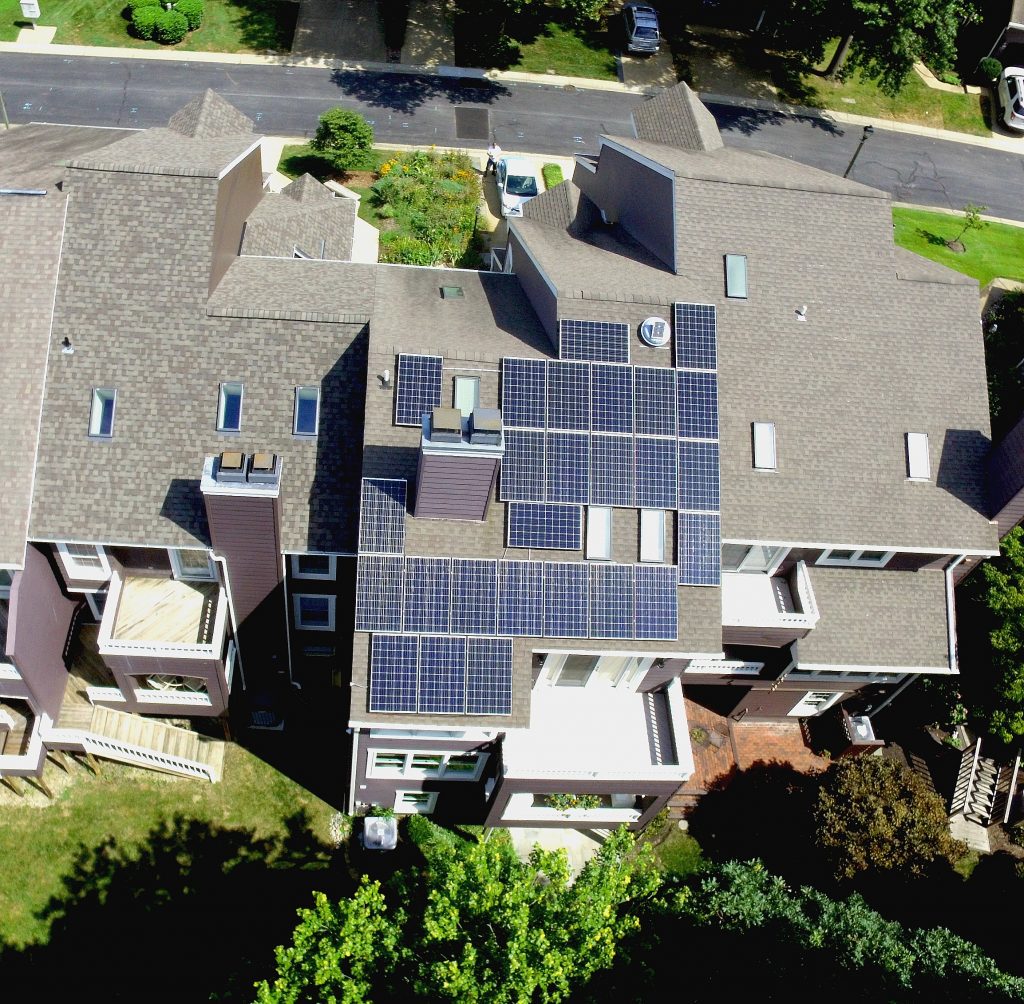
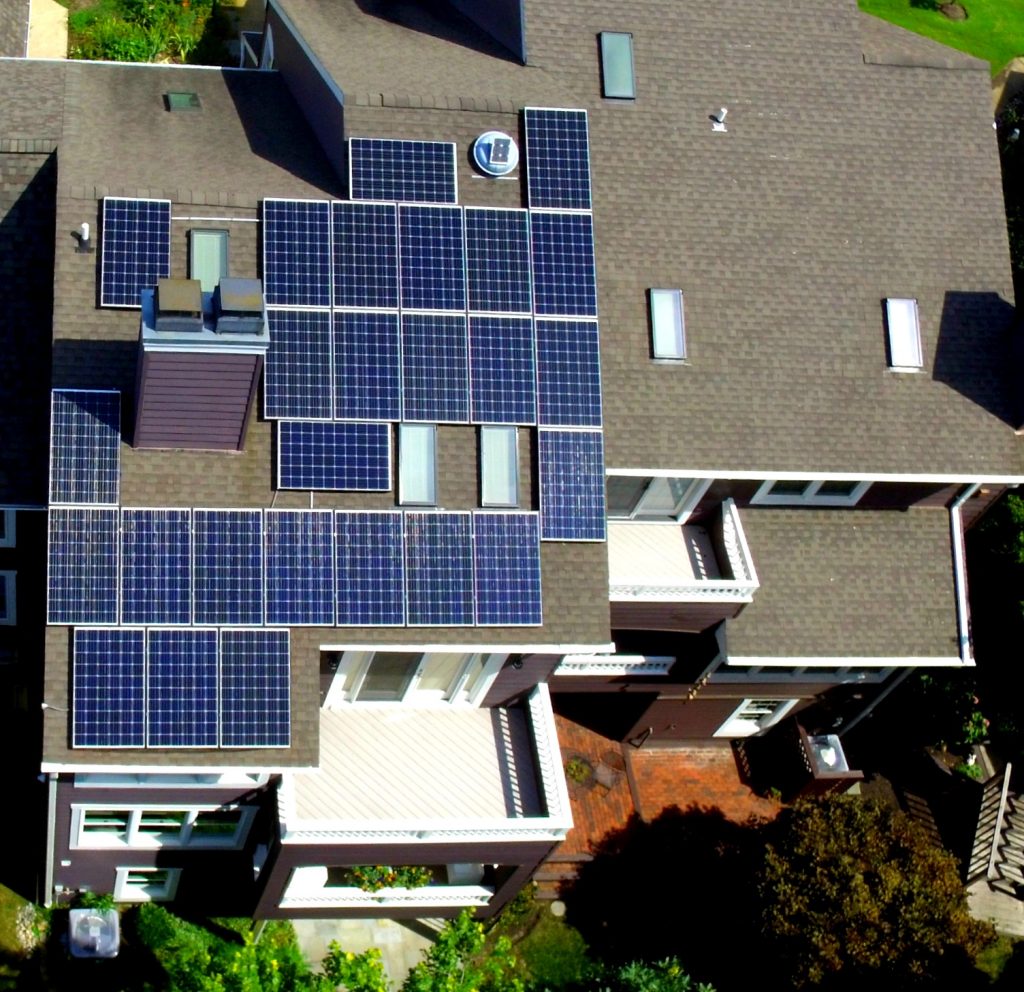
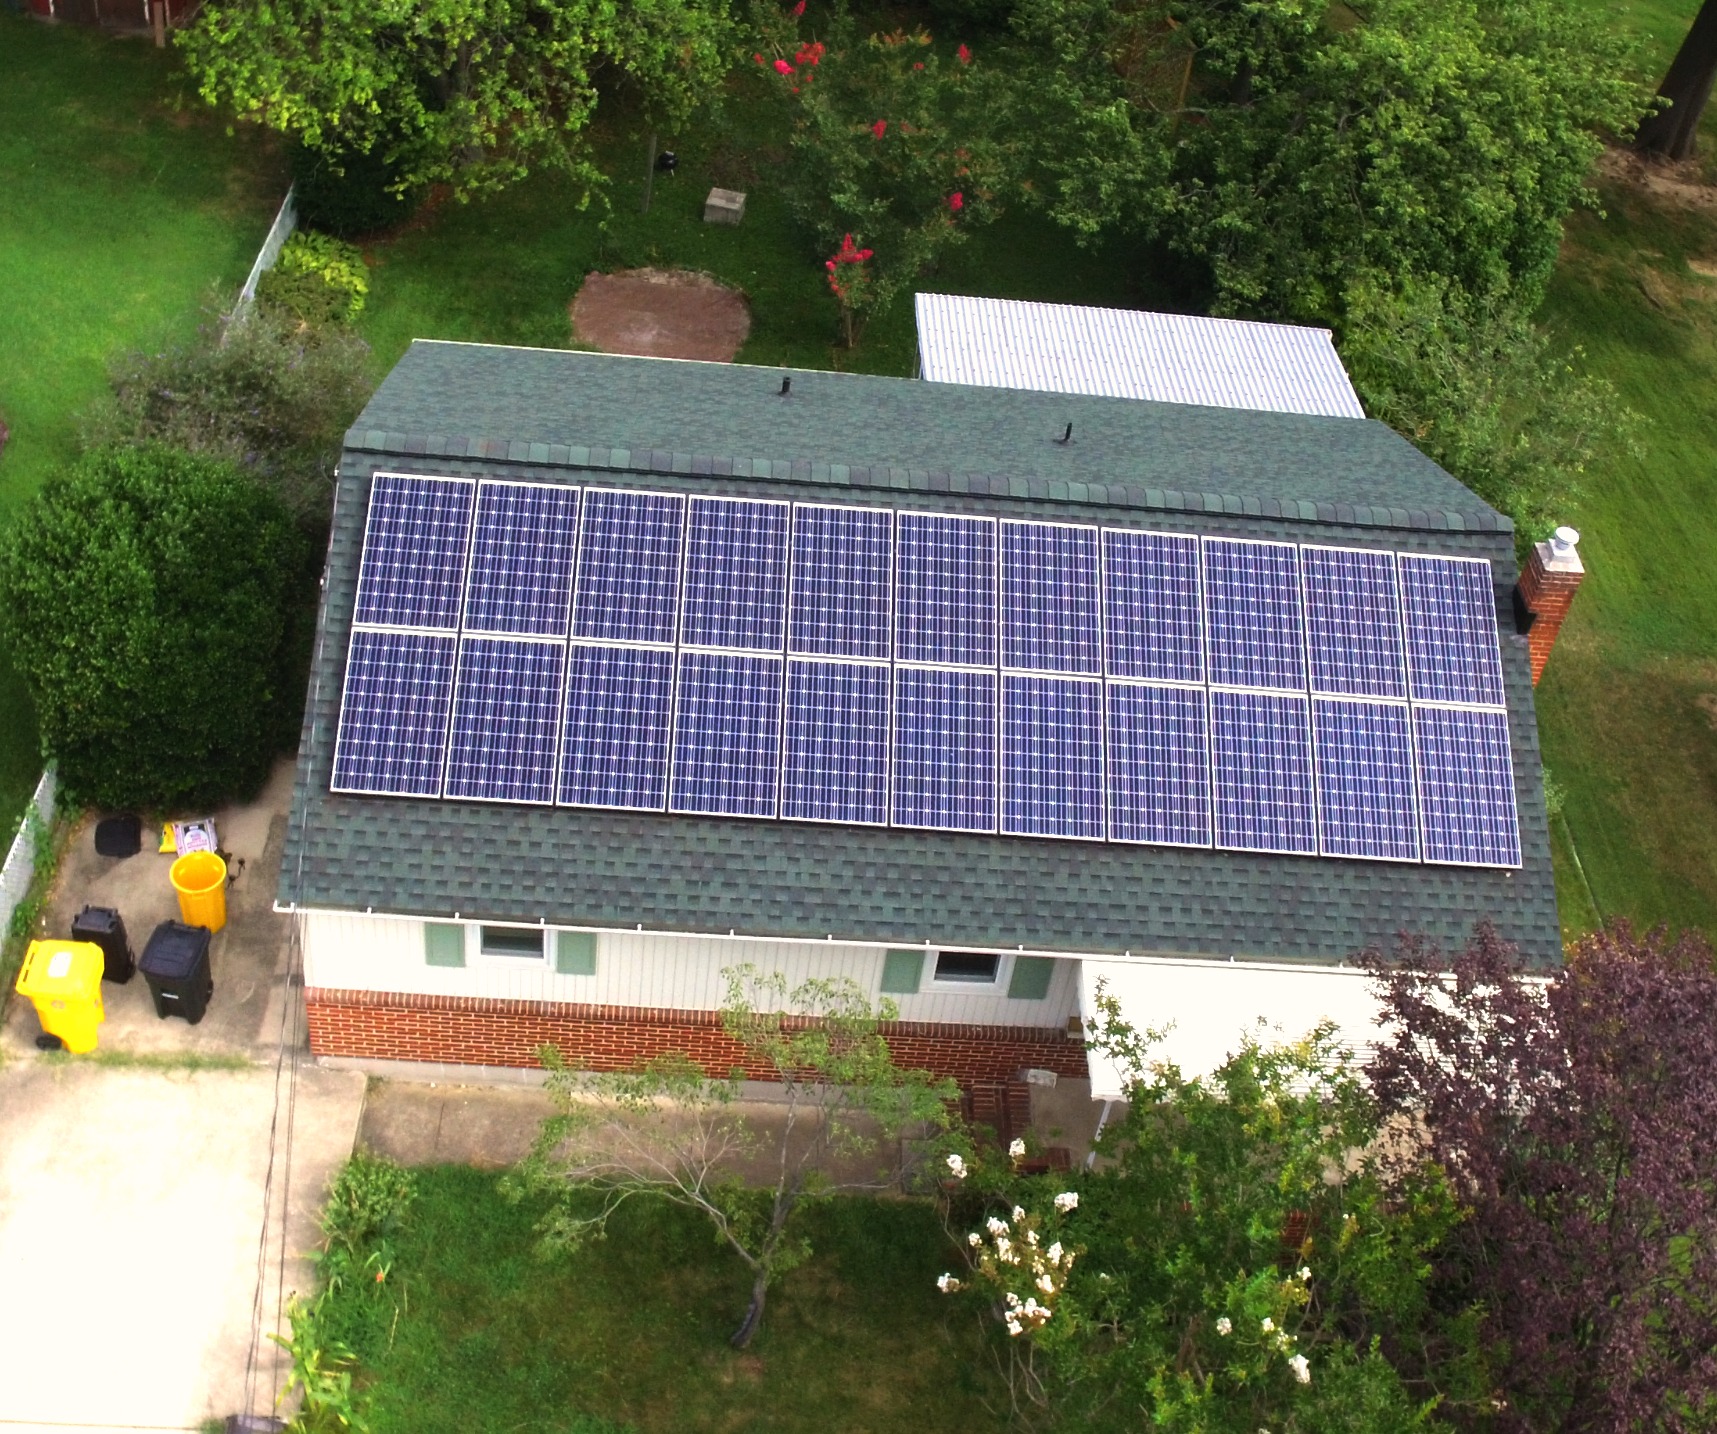
Installation Pictures From The Sky: MSSI Installation in Brandywine, Maryland
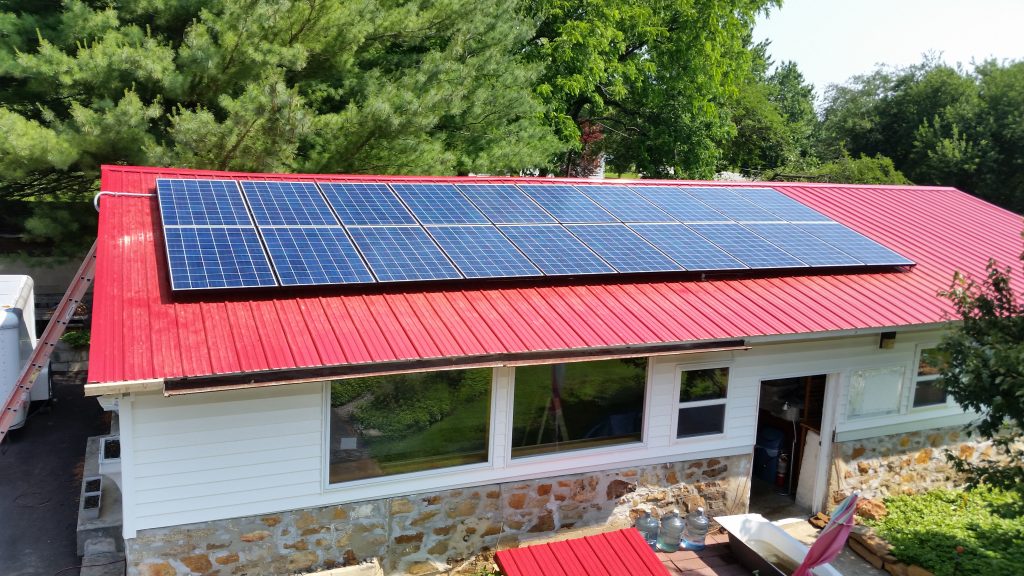
Living in a neighborhood with an HOA that was concerned about the aesthetics and glare coming off of solar arrays. we were happy to offer our Triple Black panels; all of our panels are glare-proof, but the Triple Blacks are all black. Typical panels have a white back sheet and the silicon that has a blue cast to it. The Triple Blacks have a black back sheet, black frame and use a black silicon.
This is a 7.54 kW system that has produced 20.18 MWh since being installed in December 2014.
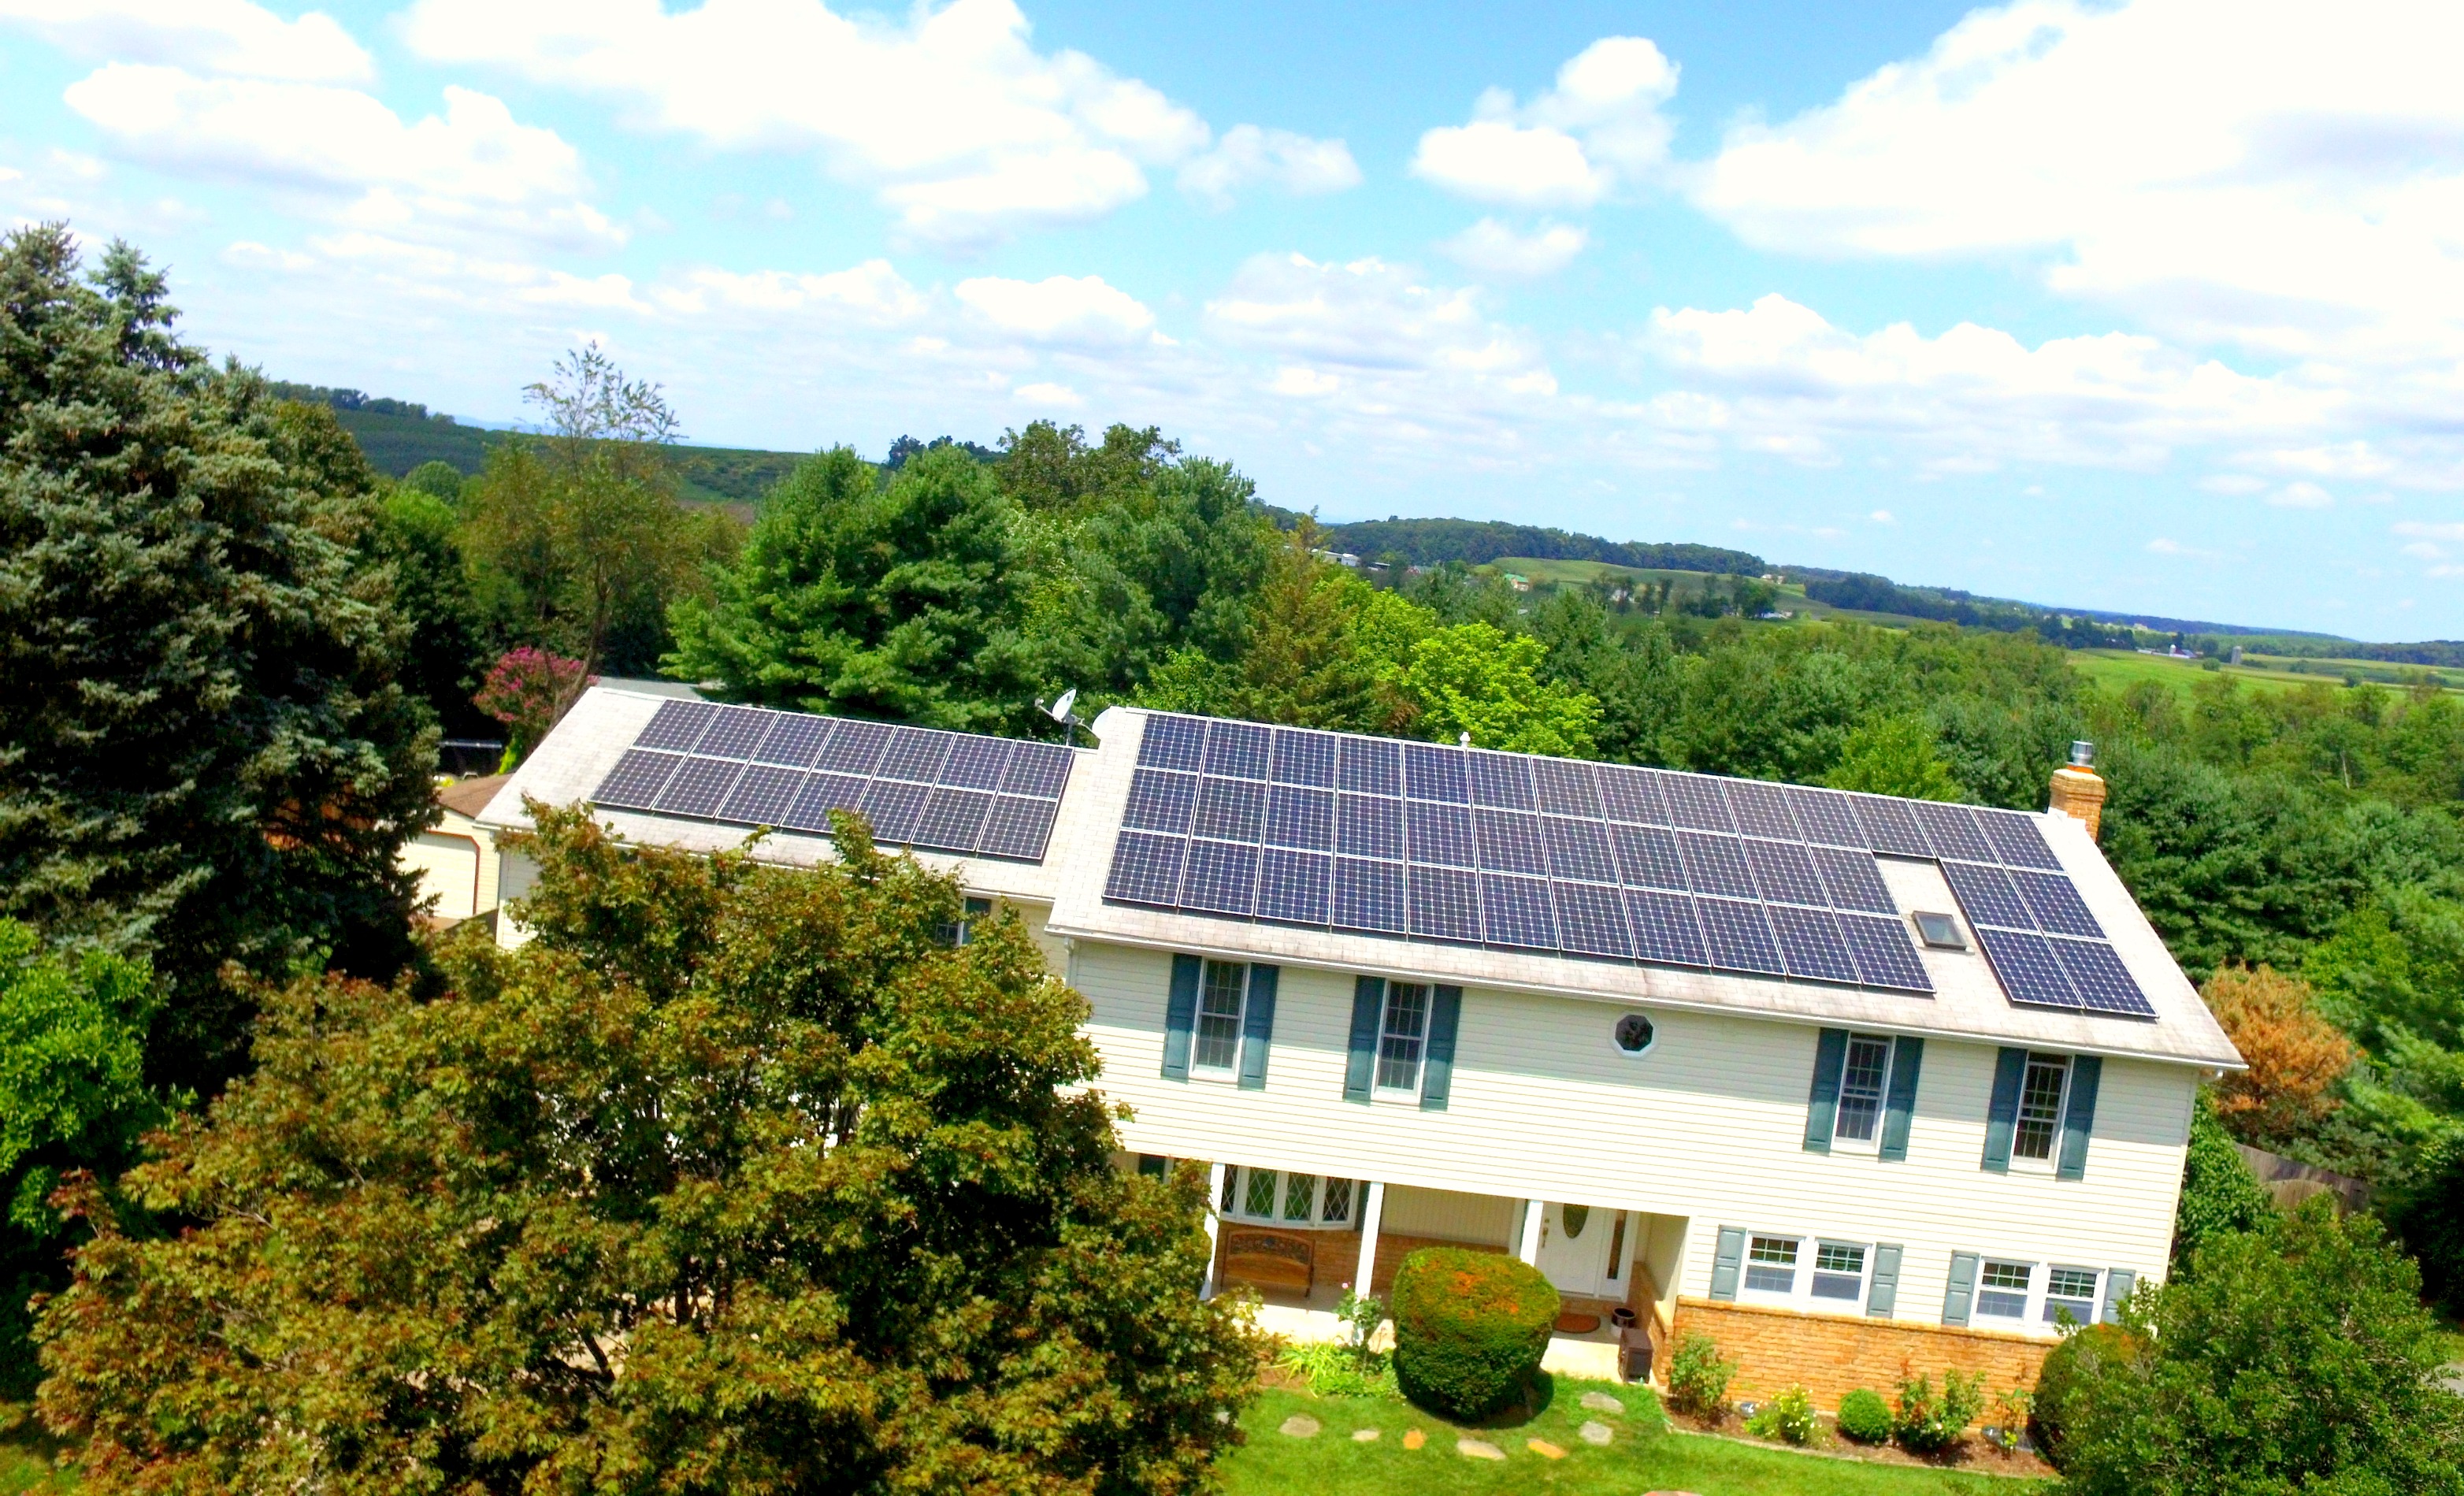
Installation Pictures From The Sky: MSSI Installation in Westminster, Maryland
This lovely 15.66 kW system was installed in July 2015 in Westminster, MD. Having been on-line for just over a year, this system has already produced 27.81 MWh!
Initially looking to lease, this customer decided to install this gorgeous array instead!
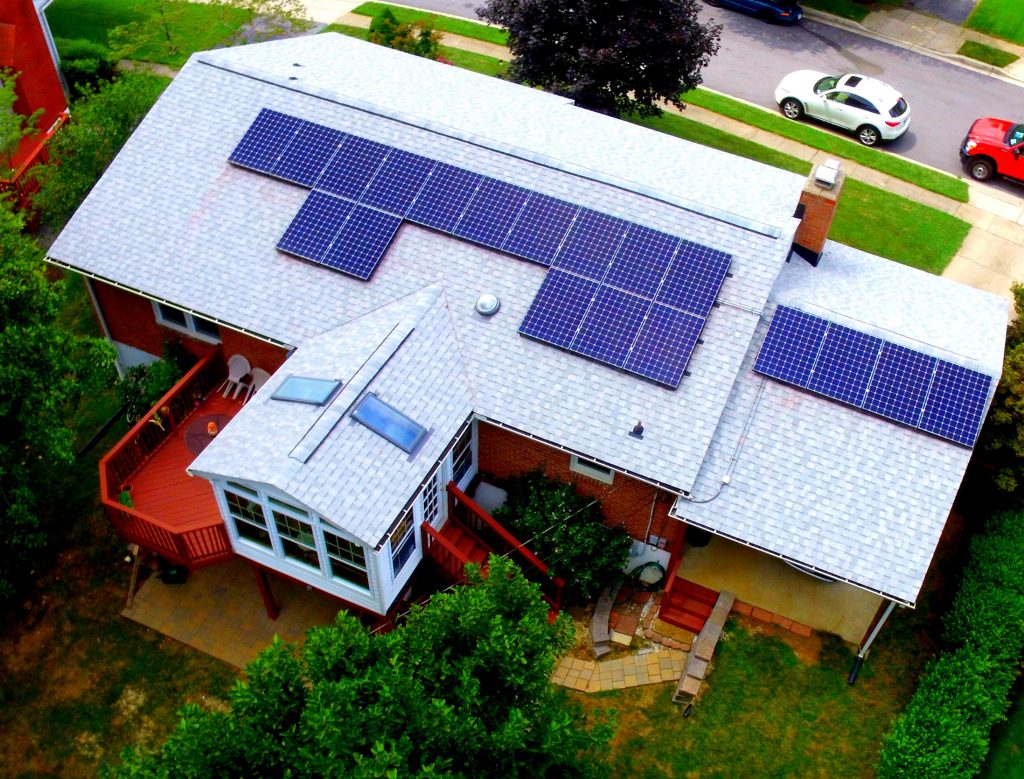
Installation Pictures From The Sky: MSSI Installation in Timonium, Maryland
Online since October 2013, this 6.21 kW system has churned out a whopping 22.3 MWh, giving this homeowner of the satisfaction of saving 34,529 lbs of carbon dioxide from entering the atmosphere; equivalent to having planted 869 trees!
Installation Pictures From The Sky: MSSI Installation in Annapolis, Maryland
After reading an article about PV solar power in the magazine Fine Homebuilding, this homeowner was inspired to look at what solar could do for him.
With a projected 45% coverage of his electrical usage, this 5.4 array has produced 4.4 MWh of electricity since going on-line in April 2016. Since spring this year, this array has already saved 6,921 lbs of carbon dioxide from entering our atmosphere, an equivalent to 174 trees!
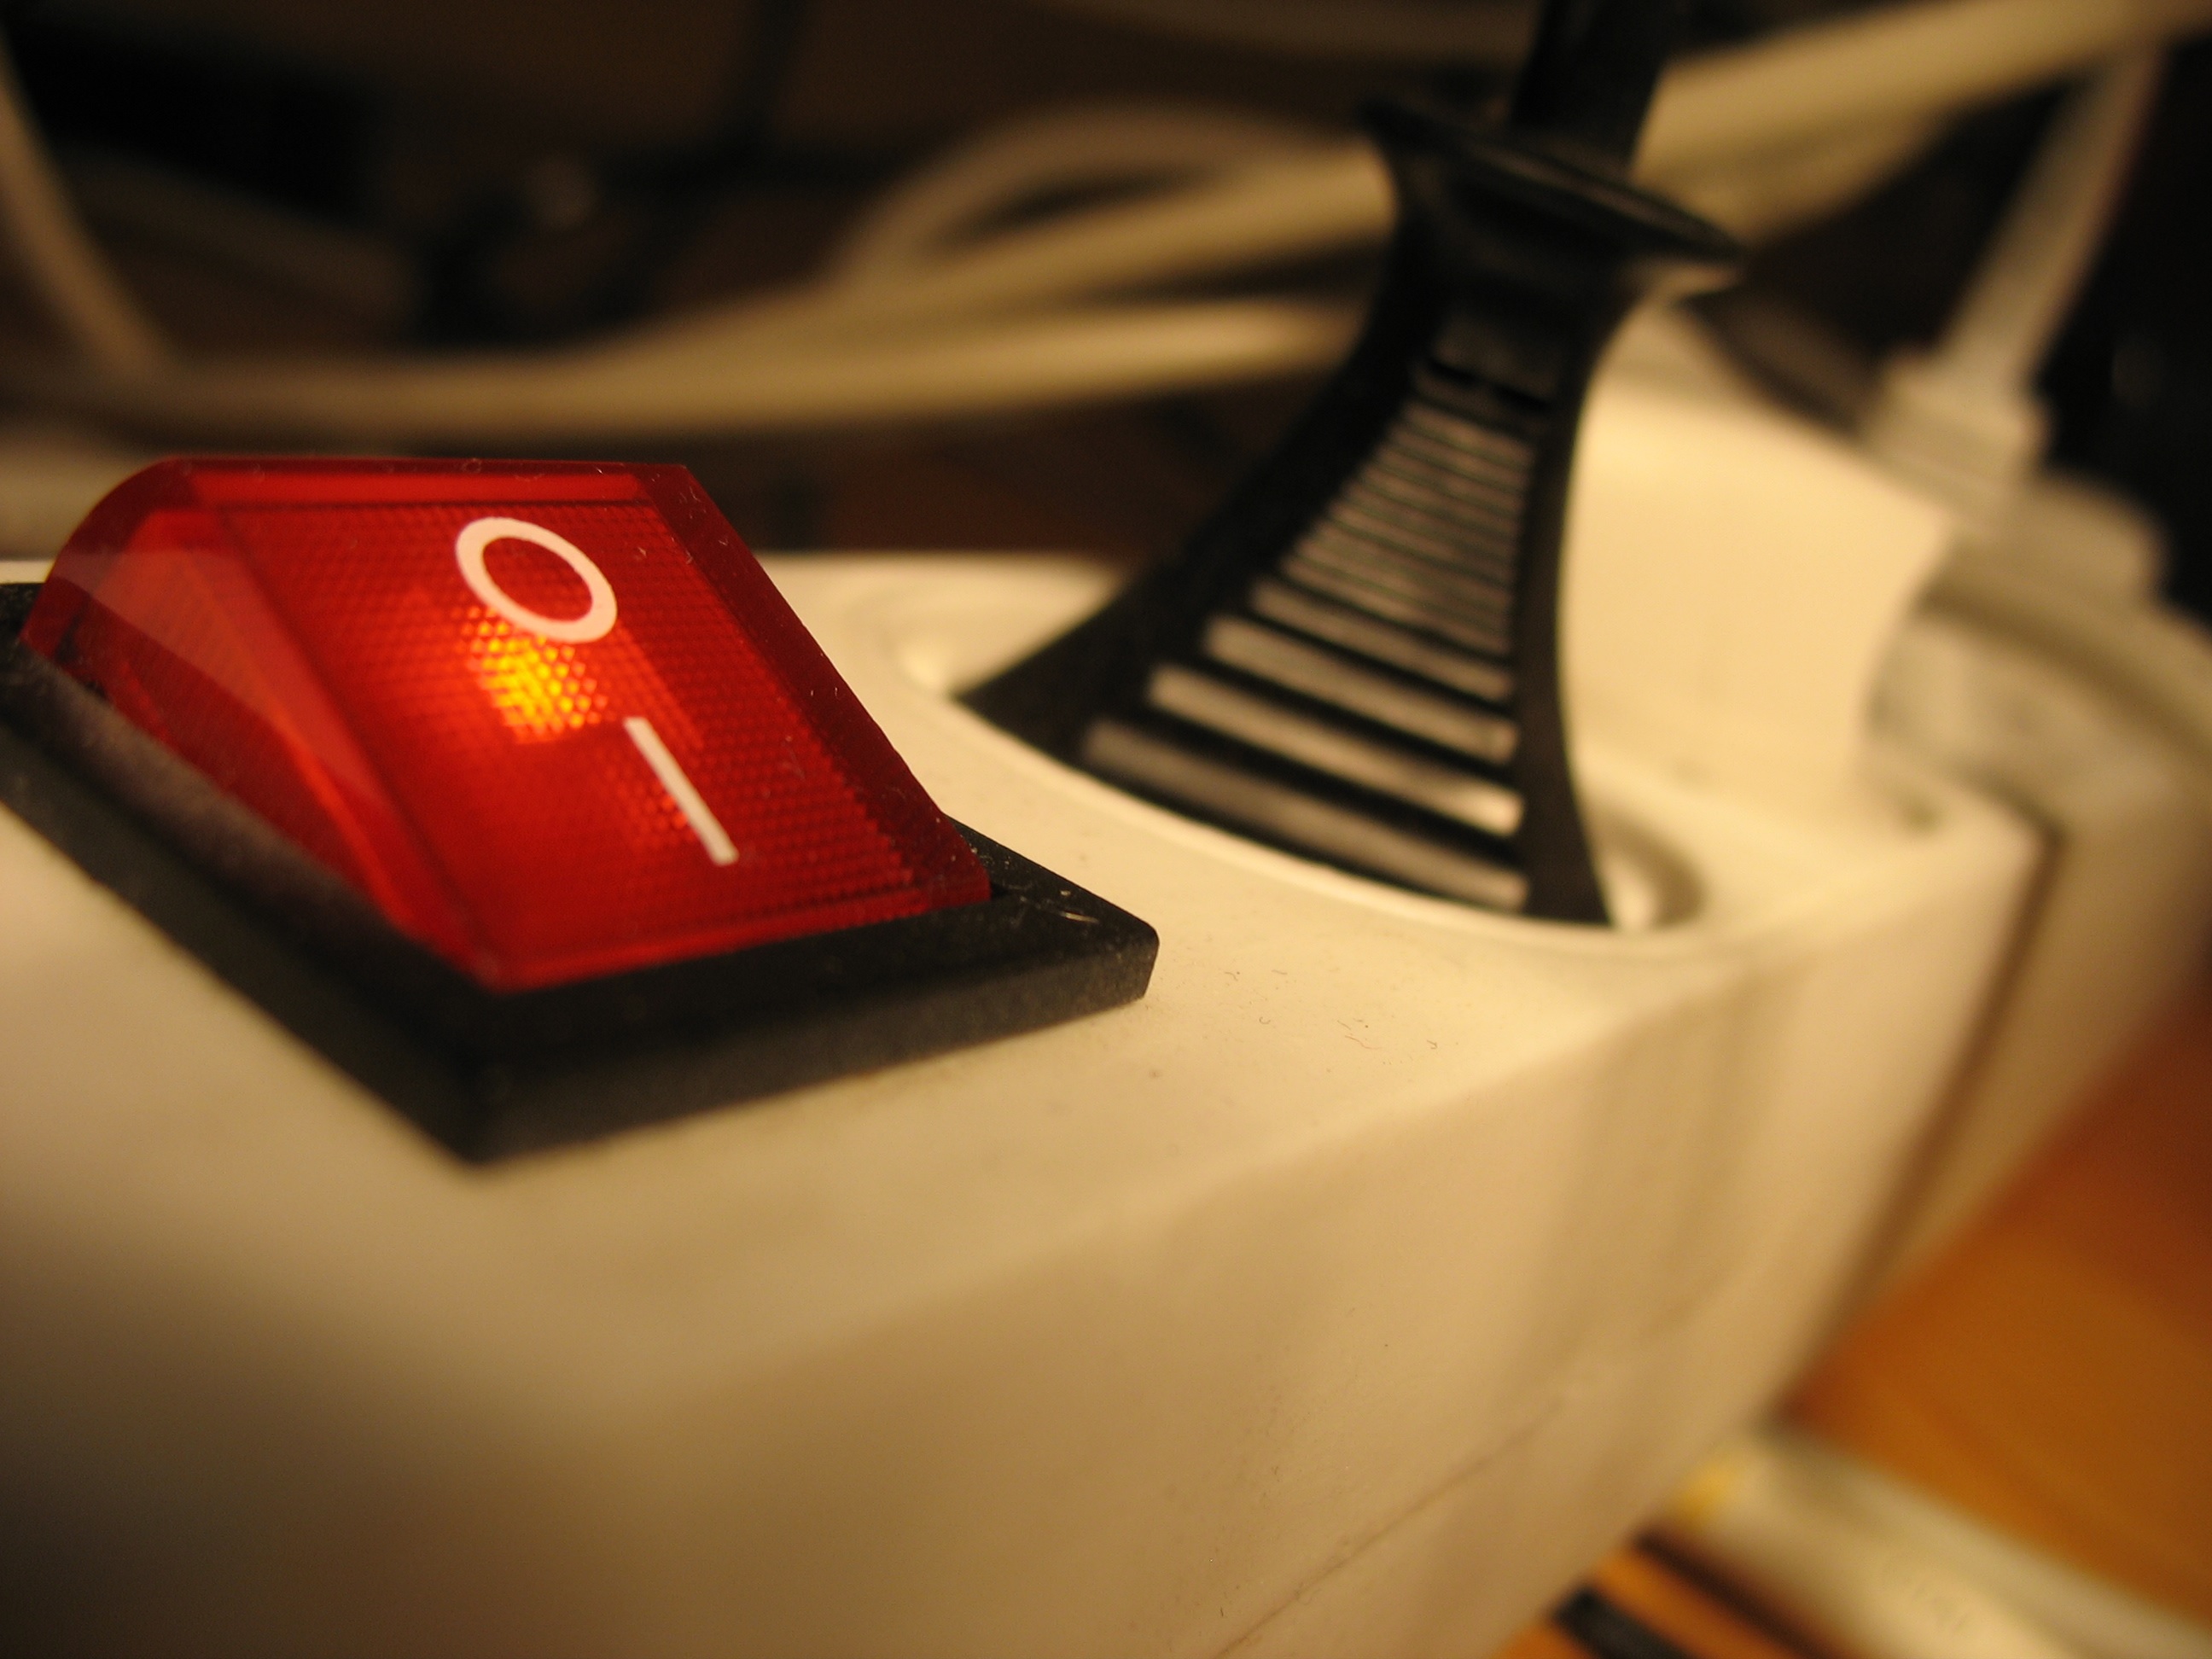
Killing Your Solar Investment with Vampire Energy!
Standby. Vampire. Phantom energy. The same phenomena, different names, but no matter what you call it, it adds up to the same thing: energy being used to power items that you are not actively using. Needless to say, this puts an unnecessary drain on your wallet and/or PV solar array. Well, we’re here to tell you how to kill off that vampire once and for all and to further maximize your investment in solar.
What Exactly Is Phantom Energy?
There are a whole host of appliances and electronics around the house that technically remain on, even when not “on” or in use. Either they remain is standby mode, such as TV’s so that when you turn them “on” they light up and start displaying immediately; or they draw energy to power ancillary elements within the components themselves such as clocks. The EPA estimates that idle electronic devices use up to $10 billion in energy annually.
What does that look like in the home? We looked at four people in our office as examples of how vampire energy impacts our everyday lives. We based our calculations upon this handy chart that enumerates the average amount of energy needed to power electronics that are not being actively used.
Our four participants used very different kWh totals due to the different types and quantities of items used in their homes. For the sake of this example, we only counted the standby or “off” usage of electronic gadgets. The items used? Everything from cell phone chargers to laptops, coffee makers and microwaves, to TVs and cable boxes.
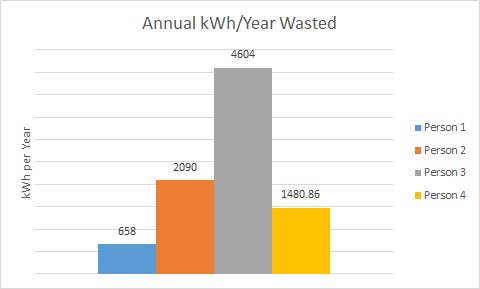
Here is an illustration of how much energy each person used to power unused items per year:
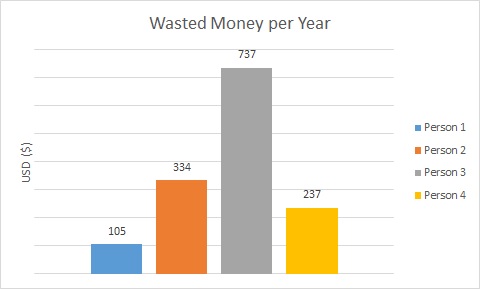
As you can see the highest phantom energy user stands to save about 4,604 kWh a year! How much are you inadvertently using? How much of your solar array is powering items you don’t need to have on? What does this look like in a dollar amount?
As you can see, failing to address phantom energy has the potential to sap your solar investment of life!
The Silver Bullet?
It would be a total drag to go around unplugging our gadgets individually, so instead use power strips. These are easier to place within reach and affectively ensure that all items drawing electricity are fully and effectively turned off. What’s the payoff? Faster payback and bigger bang for your buck!
We encourage you to look around your house and kill those vampires!
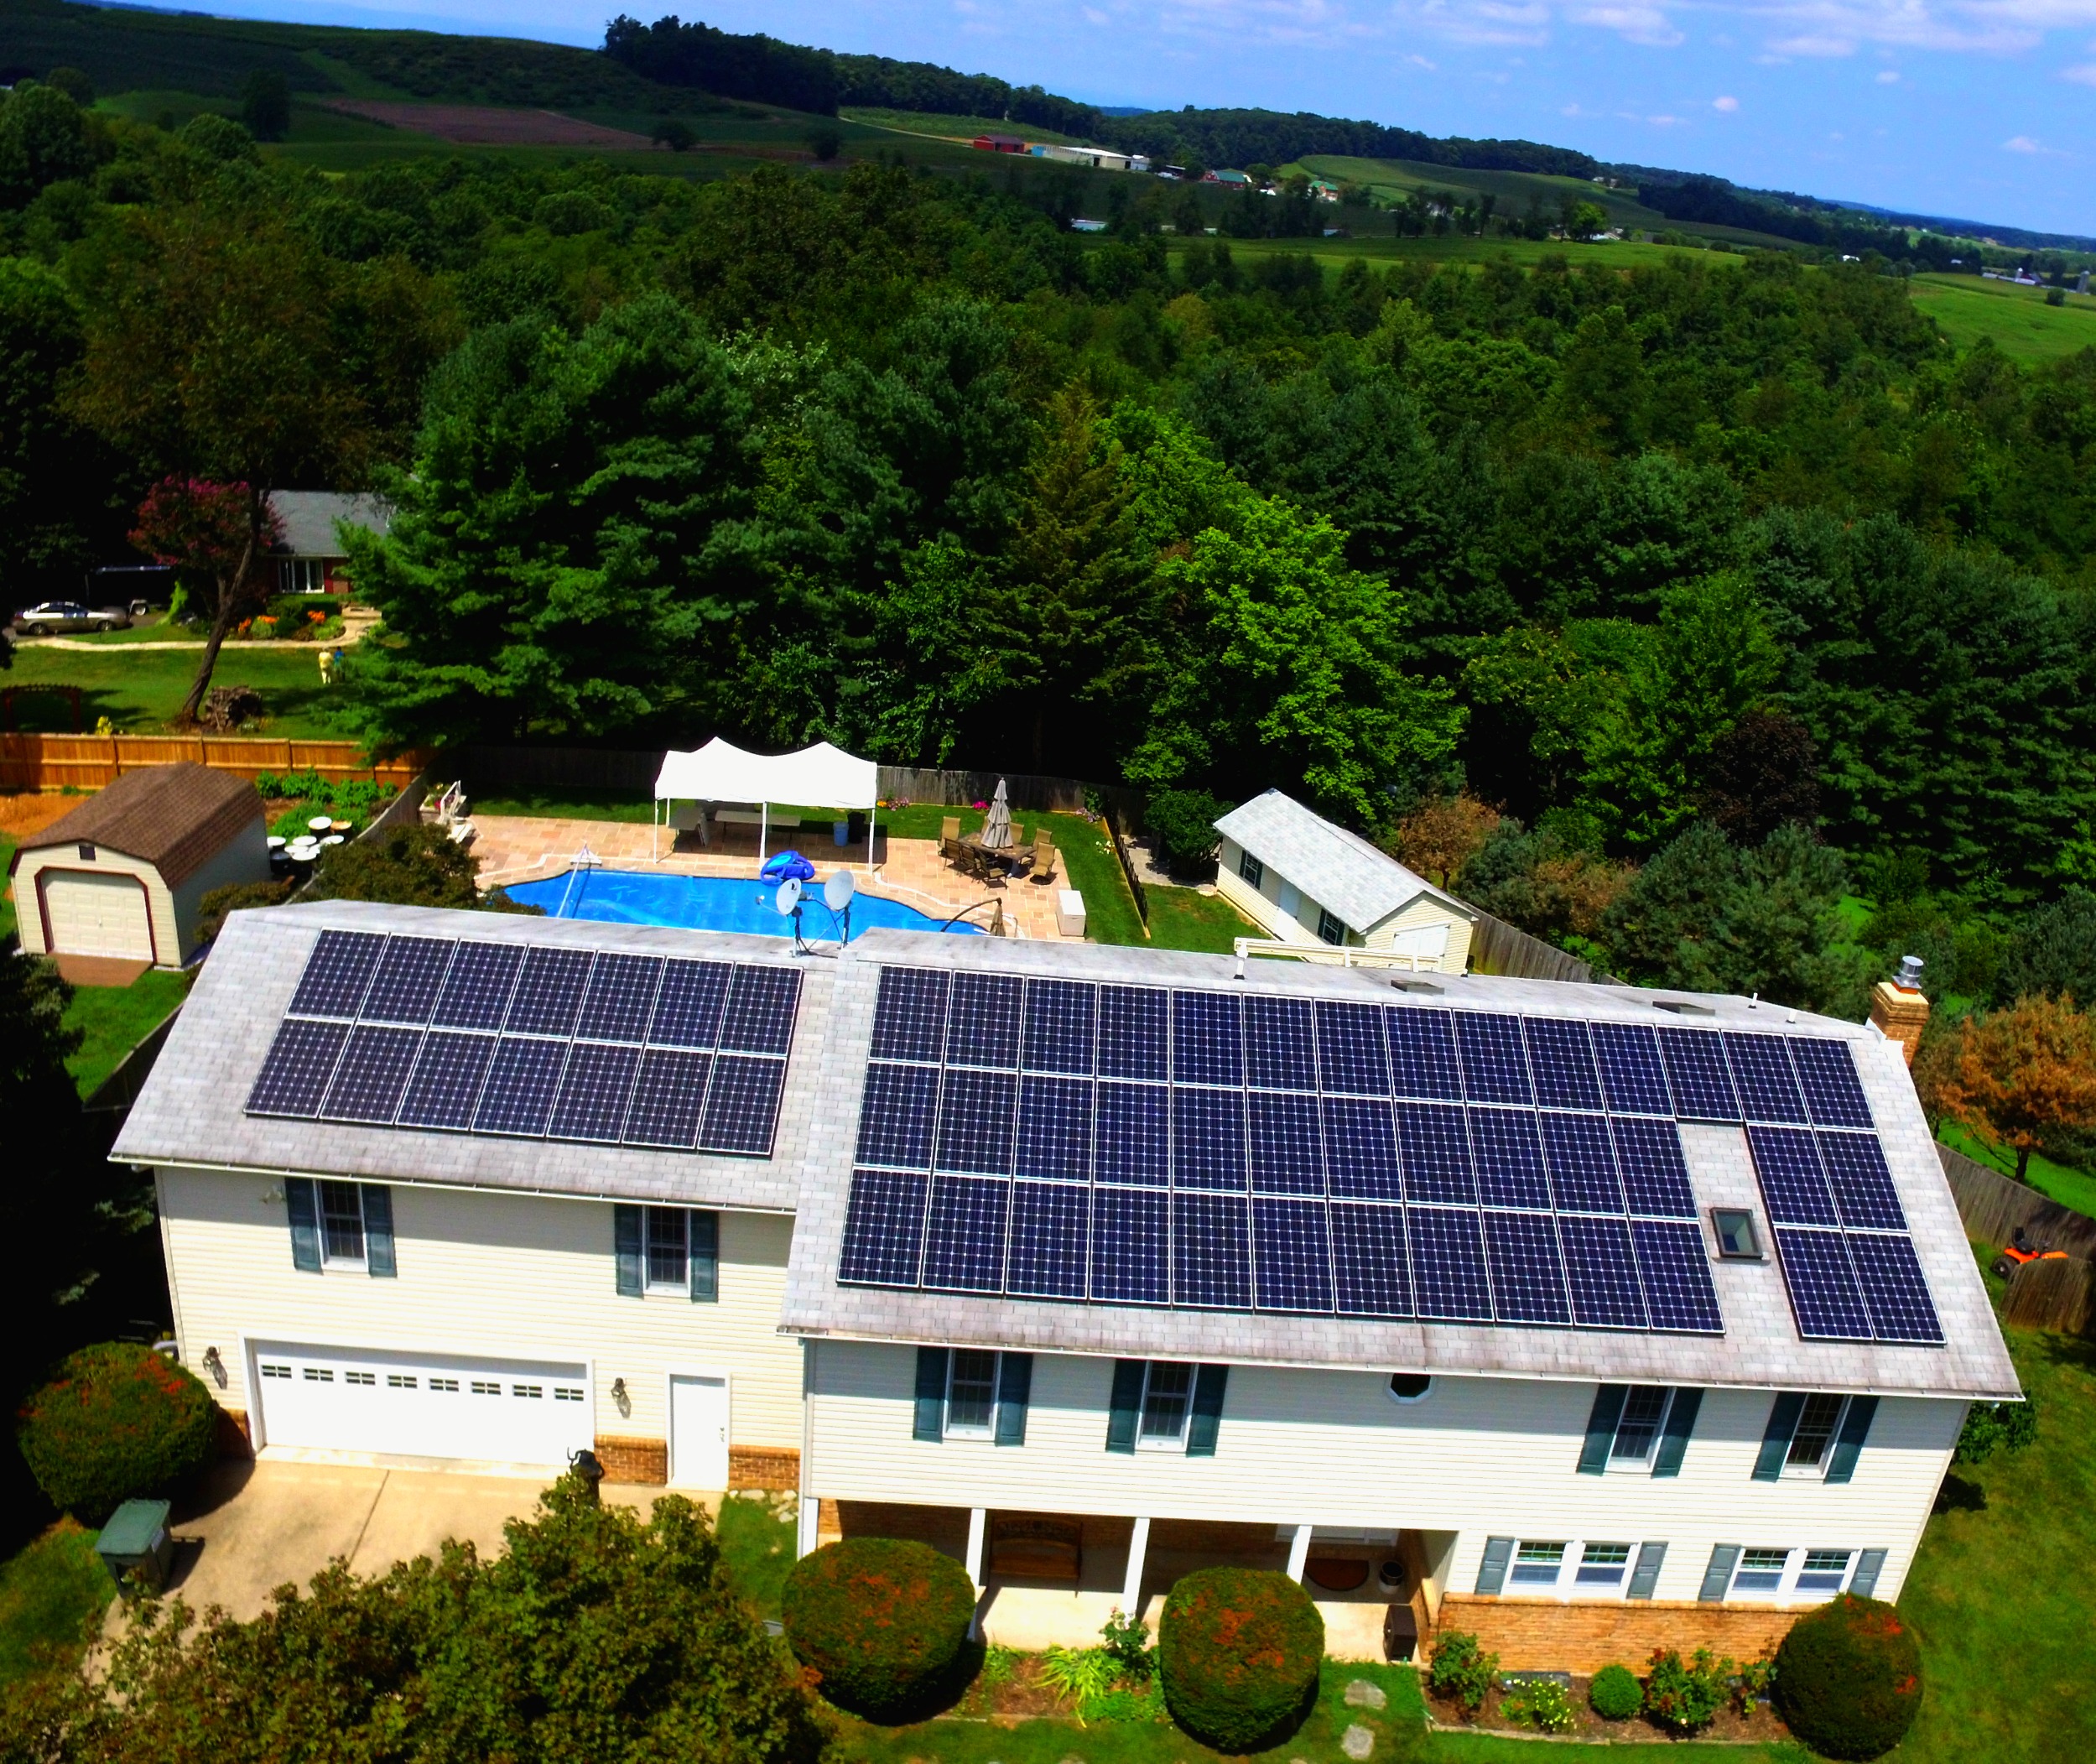
Installation Pictures From The Sky: MSSI Installation in Annapolis, Maryland
This customer in Annapolis was looking to lower her high electric bills due to her hobby as an aquarist; her fish tanks were driving up her usage. Interested in high-quality equipment that will stand the test of time, she opted to go with MSSI and our commitment to using the highest-quality and incredibly well-vetted equipment.
Working diligently, we designed a 7.8 kW system that would cut about a quarter of her electrical usage. Since inception in December 2015, this system has generated a total of 8.62 MWh of electricity, equal to having planted 336 trees and saving 13,343 lbs of carbon dioxide from entering our atmosphere.
Earlier this year, we explored small trees and large shrubs that create solar-friendly shade. Today, we’re going to look at how to create that much needed, yet solar-friendly shade directly on the walls of your home during those “dog days of summer.” First, we’ll talk a little bit about passive solar design principles. Then vines that can be used in conjunction with structures to create even more shade. In either case, the goal here is to create protective shading on your home that will not interfere with your solar panels.
Use Passive Solar Design
Passive solar design seeks to use what we know about the sun’s angle to our homes during each season and using that knowledge to our advantage. Utilize passive solar front porch roof structures, pergolas, arbors, awnings or other horizontal measures to shade the front; use them to shade windows, walls and doors in the summer while allowing winter sun to hit these surfaces and warm up the home.
When building a shade pergola for a conventional home using passive solar design techniques angle the slats to allow winter sun in and to block summer sun from coming in. The picture below is a good illustration of the concept.
Use a similar approach when installing an overhang. Overhangs should be long enough that they keep the high summer sun from coming in, but short enough to allow the lower winter sun to stream into your home. One could design an entire set of pergolas, overhangs and window awnings that allow for plenty of direct light in the wintertime, while allowing none during the summer!
Using Vines To Create Living Barriers To The Sun
While there are great many vines out there that we associate with being nuisances (Japanese Honeysuckle and Kudzu are two that come to mind), there are plenty of native, non-invasive vines that are quite polite, are beneficial for local pollinators and “play nice” with neighboring plants and structures.
Coral Honeysuckle is a high-climbing, twining vine 3-20 ft. long, with gorgeous red flowers appearing in mid-spring. Hummingbirds adore this plant. Full sun, clay soil is well tolerated and is semi-evergreen.
Pipevine, also known as Dutchman’s Pipe is a fun vine with unusually-shaped flowers that is deciduous and looses its leaves in the winter. Larval host for the Pipevine Swallowtail. Sun to part-shade, fast-growing and likes moist soil.
Passionflower is well-known for its exotic flowers, but less known as a native plant! A sun lover and a fan of clay soil, Passionflower is a larval host for six different species of butterfly!
Using plants for shade is not only functional, but is also gorgeous and a great option for protecting and providing habitat for our pollinators!
As we’re sure many of you are aware, SREC values have really taken a nose dive in the State of Maryland this past year. It’s been a major bummer for us and we know that it’s been hitting our current customers hard. While we speculate that the market is depressed for several reasons, we do expect the market to reinvigorate this winter. Additionally, there is some good news for some solar customers in Maryland who live close enough to DC to enable them to sell their SRECs in the DC marketplace. Knowing how bad the market is right now in Maryland, we are eager to share this tip and to impart our knowledge on the situation.
See blog post on Flett Exchange for more info with regard to SRECs here in Maryland.
Why Has The Market for SRECs Dropped In Maryland?
Many people in the industry, ourselves included, have theorized that the market has been depressed for two reasons: low demand combined with high supply. In the first instance, there was an urgency to go solar in 2015, especially late 2015/early 2016, as the Federal Residential Renewable Energy Tax Credit was set to expire in December 2016. In fact, PV solar has been so popular in Maryland that 124 megawatts of PV solar was installed in 2015, double to the amount installed in 2014! While this amount of deployed solar has been great for the environment and is propelling little Maryland towards the head of the pack in efforts to combat greenhouse gas production nationally, it has depressed our market by flooding the market with more supply than is demanded.
That brings us to our next topic: demand. In Maryland, it is the Renewable Energy Portfolio Standards put forth and set into law by the Maryland General Assembly that drives the SREC market. The RPS dictates how much of our consumer market electricity must be generated from renewable sources. If a Maryland utility is unable to generate their own renewable energy, either via wind or solar, they can either pay a stiff fine or they can buy SRECs from residents and businesses that have privately invested in solar and are generating clean energy. 2016 has been what is referred to as a “compliance year.” A year in which utilities were well situated to meet their legislated goals and did not have a high demand for SRECs. In combination with an over-abundance of SRECs, the low demand has meant a depression in the market and falling prices. Essentially, the current RPS has been unable to keep up with the popularity of solar here in Maryland.
We Remain Hopeful That SRECs Will Regain Lost Value
As we reported in an earlier piece, the General Assembly in Maryland is well aware of the situation and are taking steps to stem the tide of bad SREC tidings. During the last few days of the last session, members passed revisions to the Renewable Energy Portfolio Standards contained within the Clean Energy Bill that aimed to strengthen and escalate the deployment of renewables. Unfortunately, the Governor Larry Hogan declined to sign it into law. While this an unfortunate turn of events, especially considering his prior approval of the more stringent 2016 Greenhouse Gas Reduction Bill, the Clean Energy Bill was passed by a veto-proof majority and is expected to be passed in the new year when the General Assembly reconvenes. The bill is thought to drive the demand for SRECs back up.
Is Your Home in Maryland Servicing a Feeder to DC? If So, You Are Able To Sell Your SRECs in the DC SREC Market
According to PEPCO, “in some parts of our service territory, electricity feeders may be located in Maryland, but serve residential or commercial customers in the District of Columbia. When behind-the-meter solar or other renewable energy generators are located on those feeders in Maryland, the customer is eligible for Solar Renewable Energy Credits in the District.” This may be a boon so to some Marylanders. Currently, Washington DC SRECs are selling for $480, per SREC. Check the maps below to see if you’re located on a PEPCO DC feeder line.
One of the most common questions we field at MSSI is, what can solar do for me in combination with how fast can I pay back the system I’ve had installed? These two questions are intimately involved and have everything to do with your electric usage. We pay for electricity by the kilowatt hour. Knowing our monthly kWh usage gives us a picture of what our usage is annually. Once we know that number, we can more accurately know what size system you need to meet your goals and/or current electrical demand. For instance, if I’m using 12,000 kWh per year and I want to cover my usage 100% with solar, my solar array would need to produce 12,000 kWh or more. On average Americans use 10,932 kWh per year. The higher your usage, the larger system you will need to have installed. The eventual size of your system depends upon your usage, goals and budget.
Finding Your Annual Usage On Your Bill
So, how do you find your annual usage without having to create an elaborate Excel sheet that you plod you way through for a year? While obscure, your bill will tell you. Below are examples of utility bills from across the state and how to discern that information from your bills.
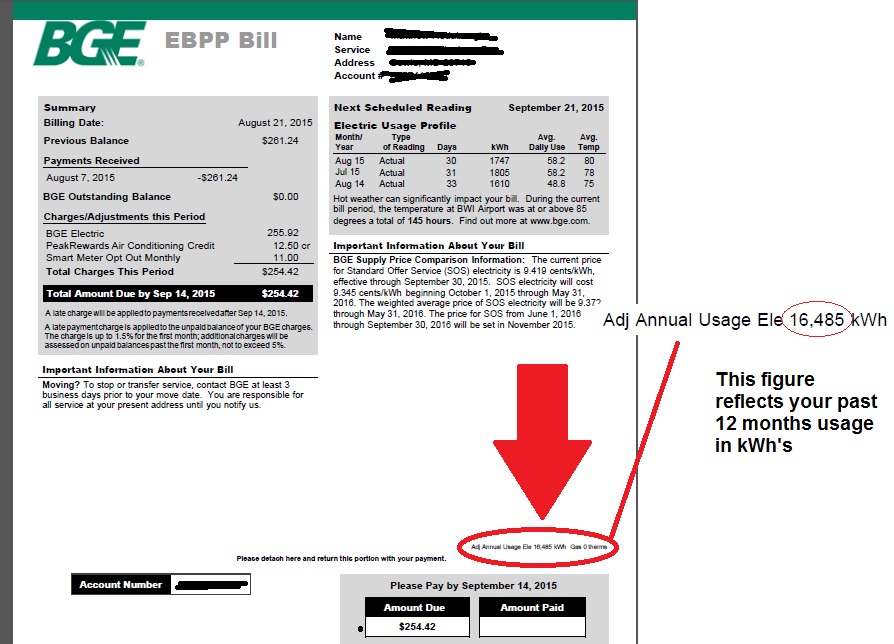
Baltimore Gas and Electric
Above the portion that you would tear off to send in with your payment, you will find the Adjusted Annual Usage. This is your current year-to-date electrical usage. The total kWh in this example is 16,485. In order to cover this usage the solar array installed would need to generate 16,485 kWh or more per year.
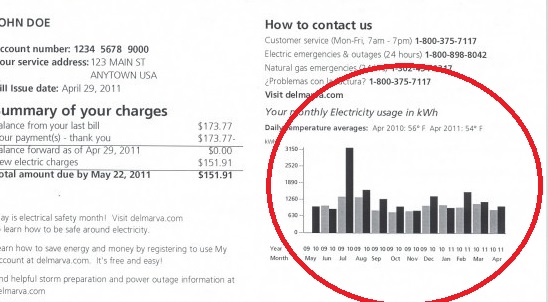
Delmarva Power
Extrapolating annual usage from the Delmarva Power bill is a little trickier than with simply finding a single number on the BGE bill because Delmarva provides your yearly kWh usage in a handy bar graph. The horizontal line along the bottom of the bar graph notates the years. In the above example the years in question are 2009 and 2010. The perpendicular line along the left hand side is indicative of the amount of electricity used.
In this instance, it looks like this family used:
May ’10: 700
June ’10: 1250
July ’10: 1260
August ’10: 650
September ’10: 630
October ’10: 700
November ’10: 650
December ’10: 1260
January ’10: 800
February ’10: 1500
March ’10: 1200
April ’10: 820
Total: 11,420 kWh
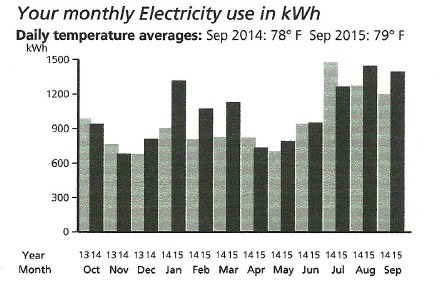
Potomac Electric Power Company/PEPCO
Like Delmarva Power, PEPCO uses a bar graph to convey annual electric usage. In this instance we’re looking at about 12,400 kWh per year.
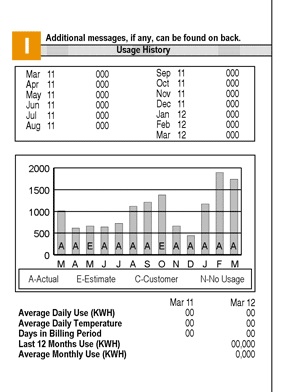
Potomac Edison
Potomac Edison bills include both a bar graph and a line item that denotes the “Last 12 Months Use (KWH).”
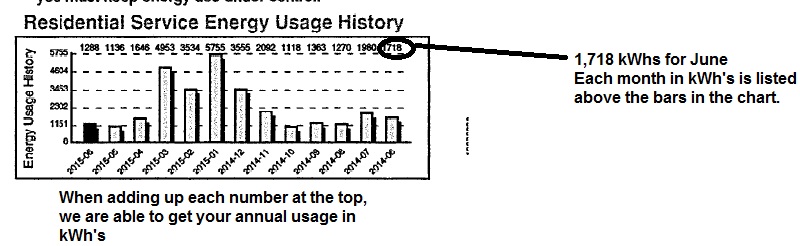
Southern Maryland Electric Cooperative/SMECO
SMECO gives you a bar graph that takes all the guess work out because your monthly usage is numerated above each bar. In this instance, the yearly usage adds up to 29,751.
This diminutive, yet powerful 6.38 kW system was installed in December 2015. This Customer was looking to cover 100% of his annual kilowatt hour usage. With this 6.38 system, he has been able to do just that!
As of October 2016, this system has saved 11,640 lbs of carbon dioxide from entering the atmosphere and is equivalent to having planted 293 trees! Woot, woot!